pv magazine Test: April 2025 Results
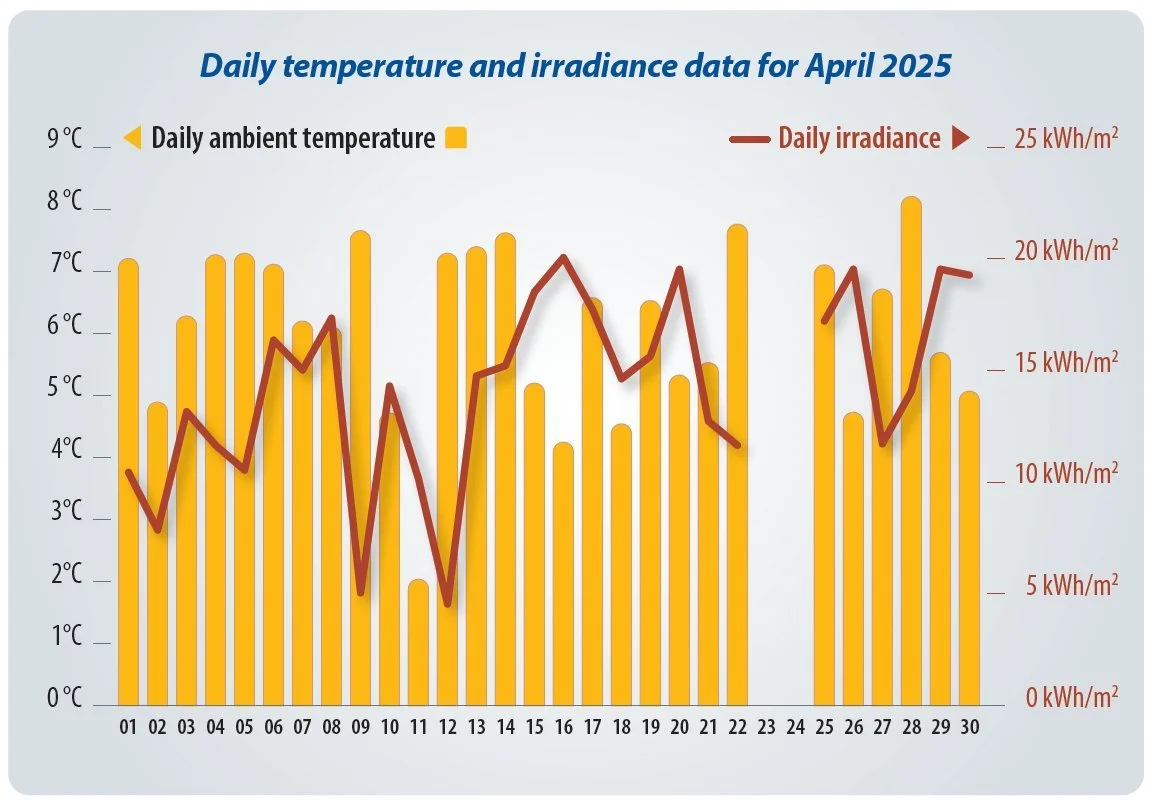
Figure 1: Daily temperature and irradiance data - April 2025
This month, we are introducing a new performance index for the tested products based on energy production per unit of the front surface area of the PV module, whereas the current ranking is based on energy production per maximum power unit of the PV module.
Since one of the main criteria for selecting PV products is the levelized cost of electricity (LCOE), we decided to add another index based on the energy production per unit of module surface area (kWh/m2). The new index has very strong dependency on the PV module front-side efficiency, which in turn has a big impact on the LCOE, as well as the energy production per installed maximum power (Wh/Wp), which we continue to measure.
A high-efficiency PV module, for example, a back-contact product, may be not ranking at the top based on energy production per maximum power, but may have higher energy per unit of area production in some cases. In order to establish a new ranking method that combines both performance aspects, we will keep monitoring the performance for both the Wh/Wp and kWh/ m2 of the samples, expecting that manufacturers will be incentivized to submit more higher-efficiency products.
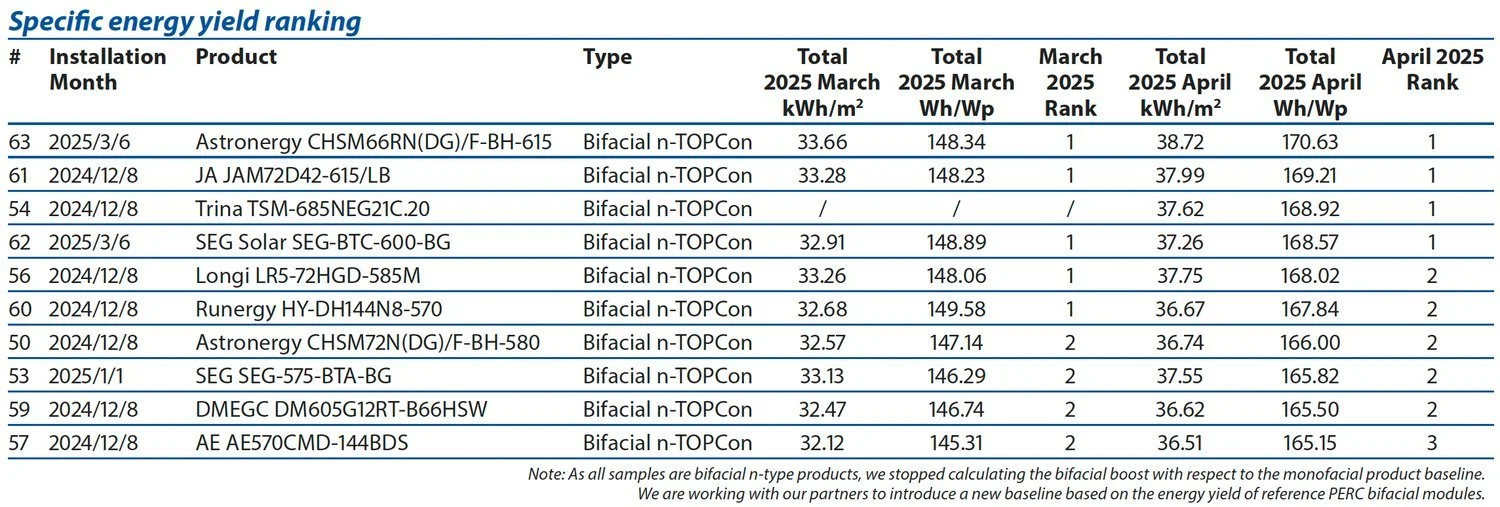
Table 1: Specific energy yield ranking March to April 2025
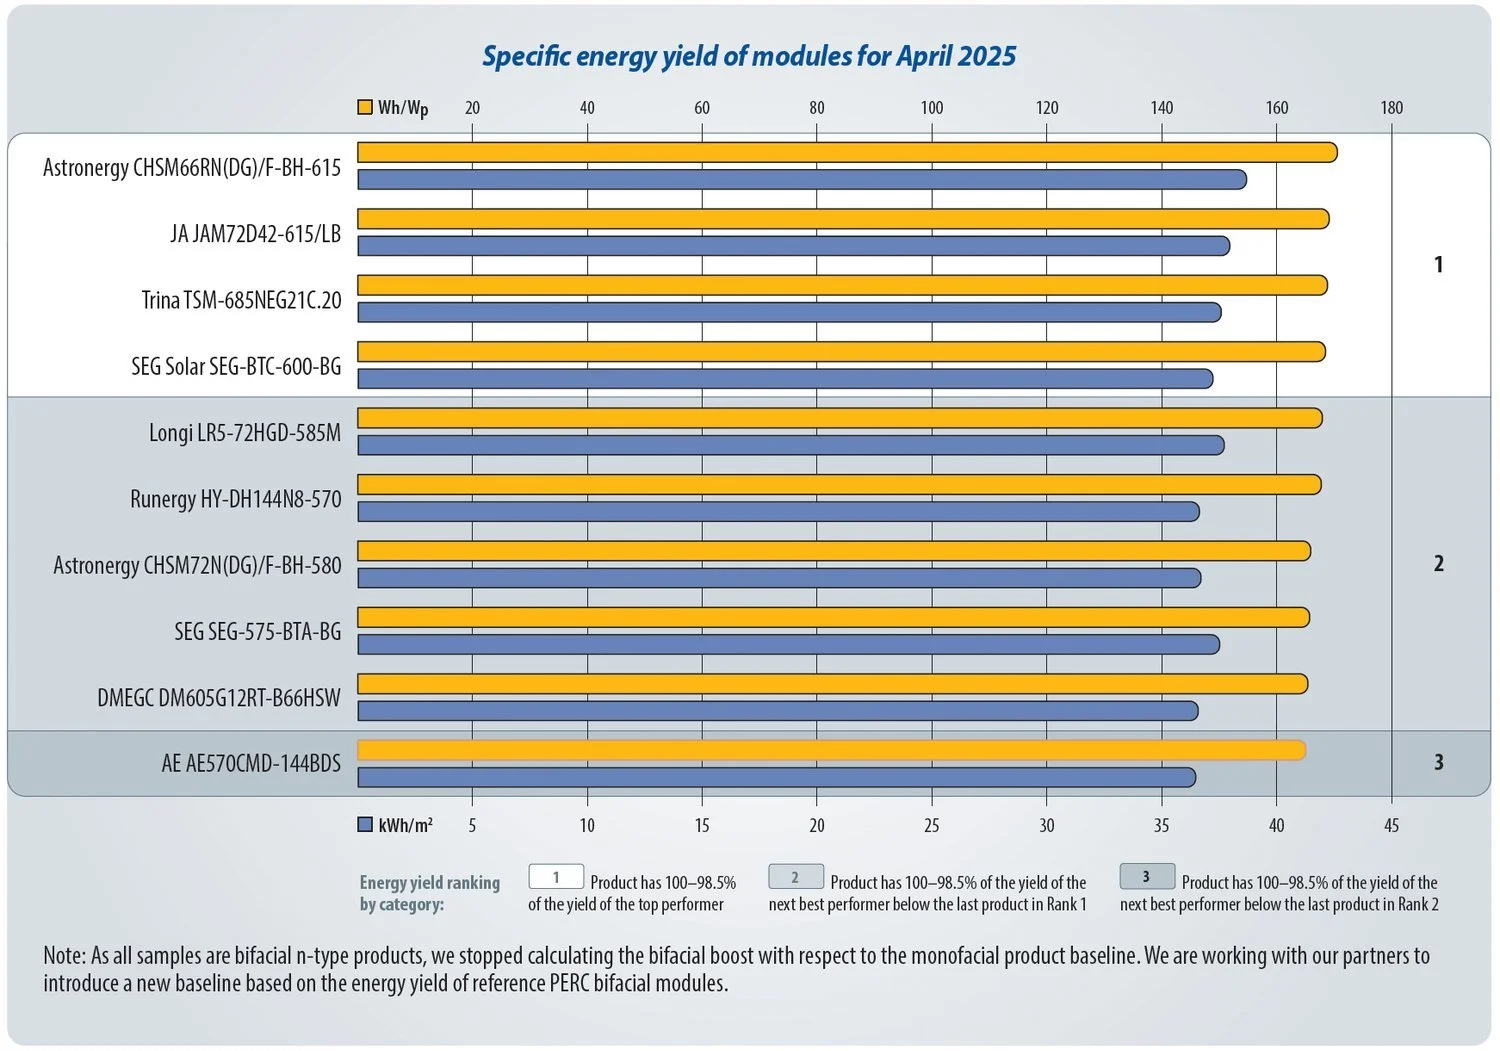
Figure 2: Specific energy yield of modules for April 2025

The pv magazine test outdoor installation is hosted by Yangtze Institute for Solar Technology at its test field in Yinchuan, China.