pv magazine Test: Annual Results
by George Touloupas and Huatian Xu
This article was originally published in pv magazine - March 2026 Edition.
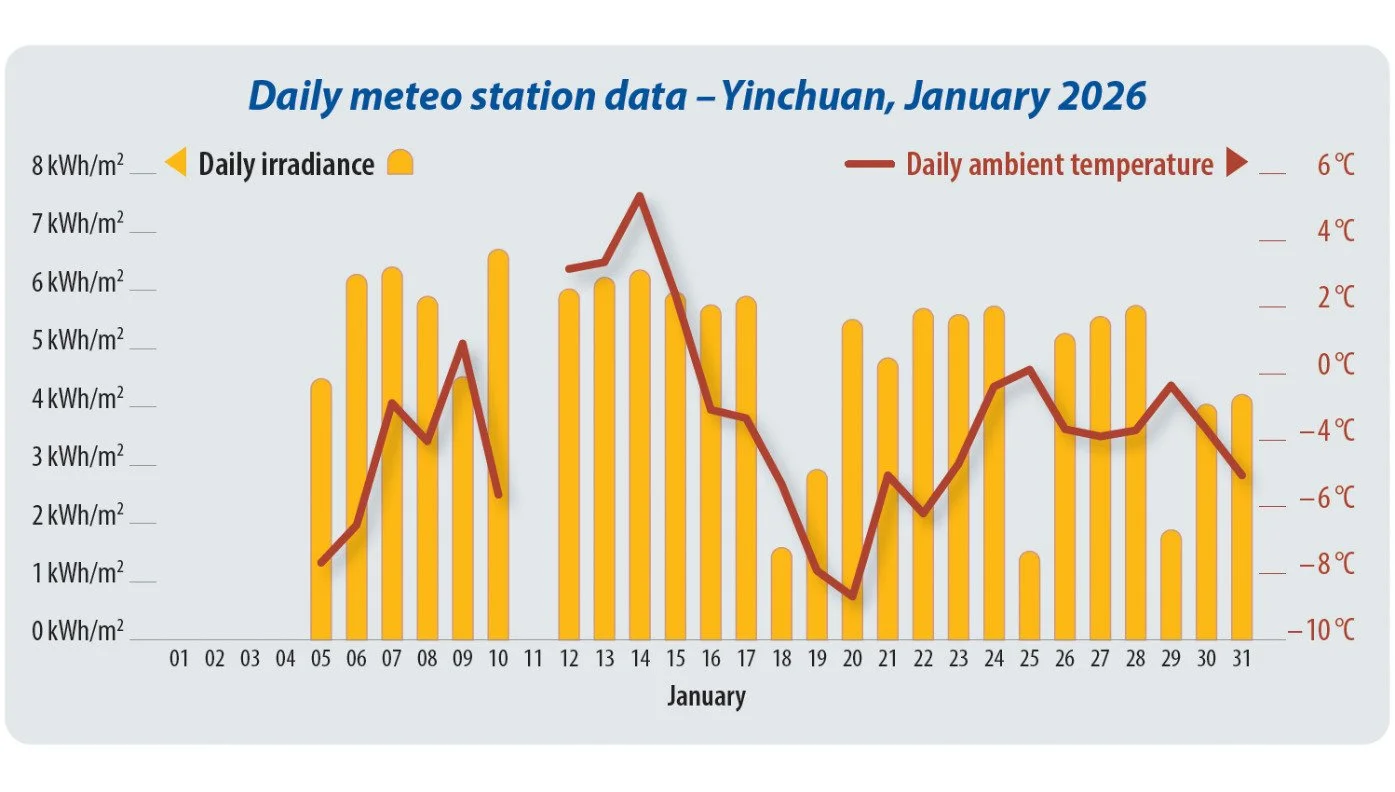
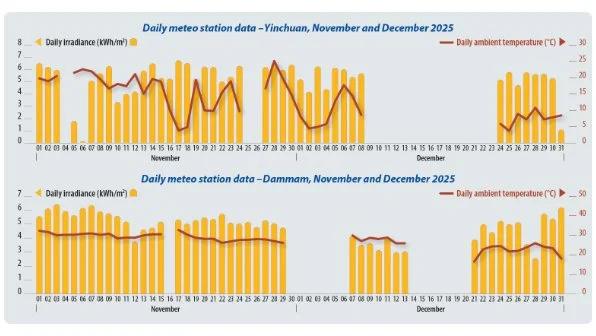
In December 2025, the pv magazine test team conducted a performance analysis of 10 different samples installed at the test field in Yinchuan, China. These 10 modules were installed in December 2024 and January 2025 and had been in continuous operation for nearly a full year. George Touloupas and Huatian Xu of Intertek CEA analyze the results and the role of various degradation modes on long-term PV performance.
For most of 2025, nearly all samples consistently maintained Rank 1 or 2 status, achieving an energy yield within 1.5% of the top performing product in each rank. This suggests uniform performance across the samples during the first nine months. A performance gap began to emerge in the second half of the year. By the fourth quarter, a subset of the samples began to consistently underperform, falling permanently behind the rest of the group in rank position.
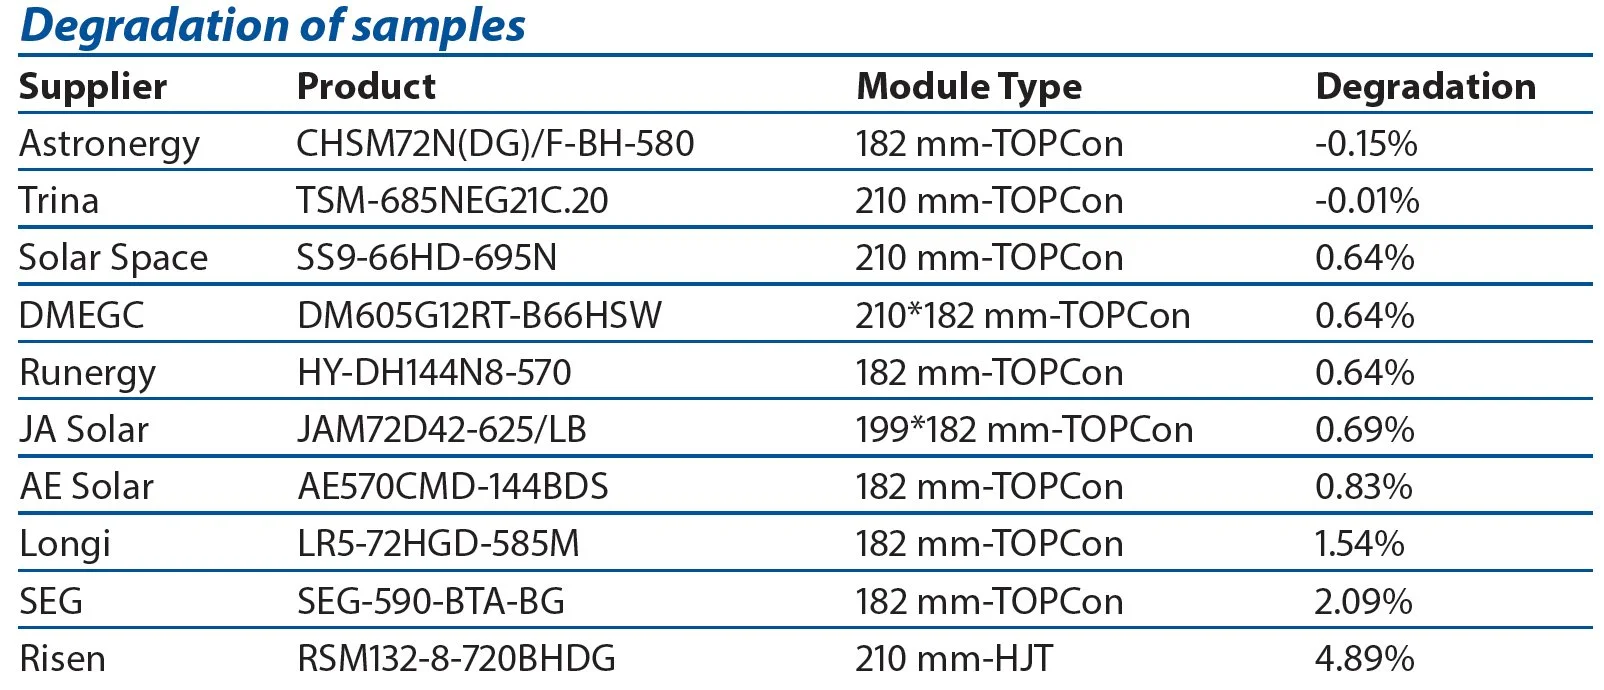
Degradation of samples
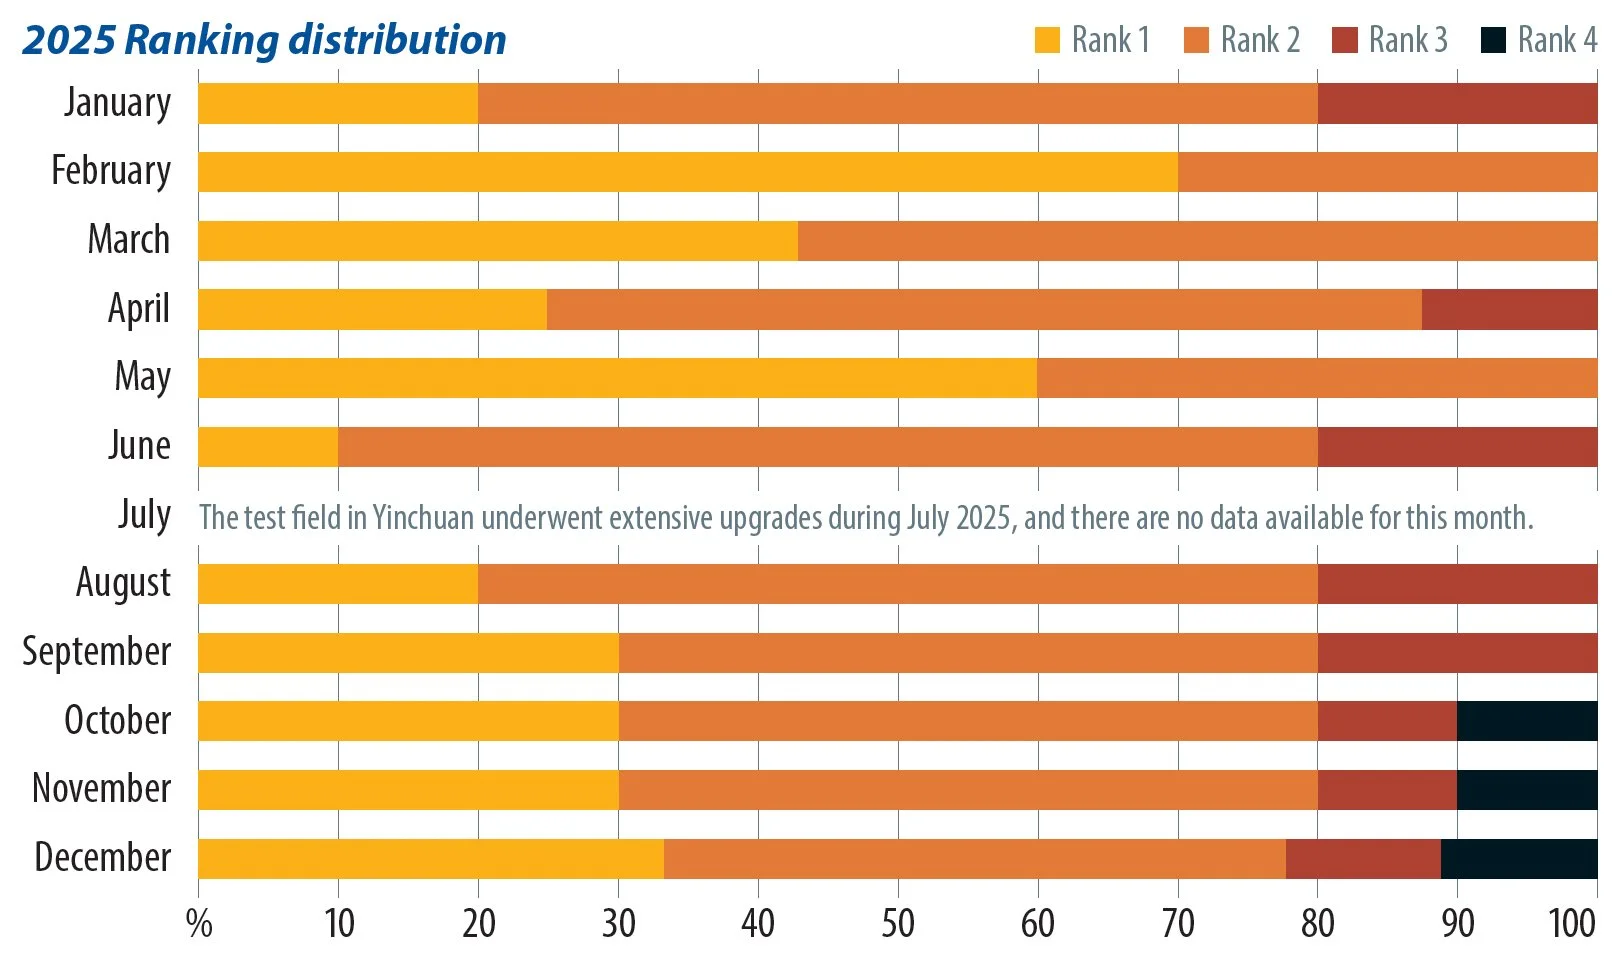
2025 Ranking distribution
Performance ratio
To analyze performance trends, we used performance ratio (PR) analysis, as it is independent of irradiance variations and depends on the intrinsic properties of the PV module. The PR of a sample over a month is defined as the ratio of the specific energy yield (total energy generation of the sample in Wh divided by its maximum power in W) to the reference yield (total number of kWh per square meter of irradiation on the plane of array).
Comparing monthly PRs of the 10 samples in January and November 2025, we observed that the average PR dropped and the distribution of results became noticeably wider (see chart top right). This indicates that significant performance deviations began to emerge among the samples toward the end of the one-year period.
These deviations are likely to stem from the degradation of the samples. In order to understand the causes of degradation we decided to retest the samples to measure their maximum power and use the new corrected figure based on this retest to recalculate the new corrected PR for November 2025. The percentage deviation of the newly measured power from the initial power is the degradation of the module.
As shown in the chart, the January PR values of the newly installed modules were high and relatively concentrated. After 10 months in operation, the November PR (based on initially measured module power) widened, with the standard deviation increasing from 1.1% in January to 1.5% in November. When the November PR data were corrected using the newly tested maximum power ratings, the standard deviation dropped back to 0.9% – a result close to the original value.
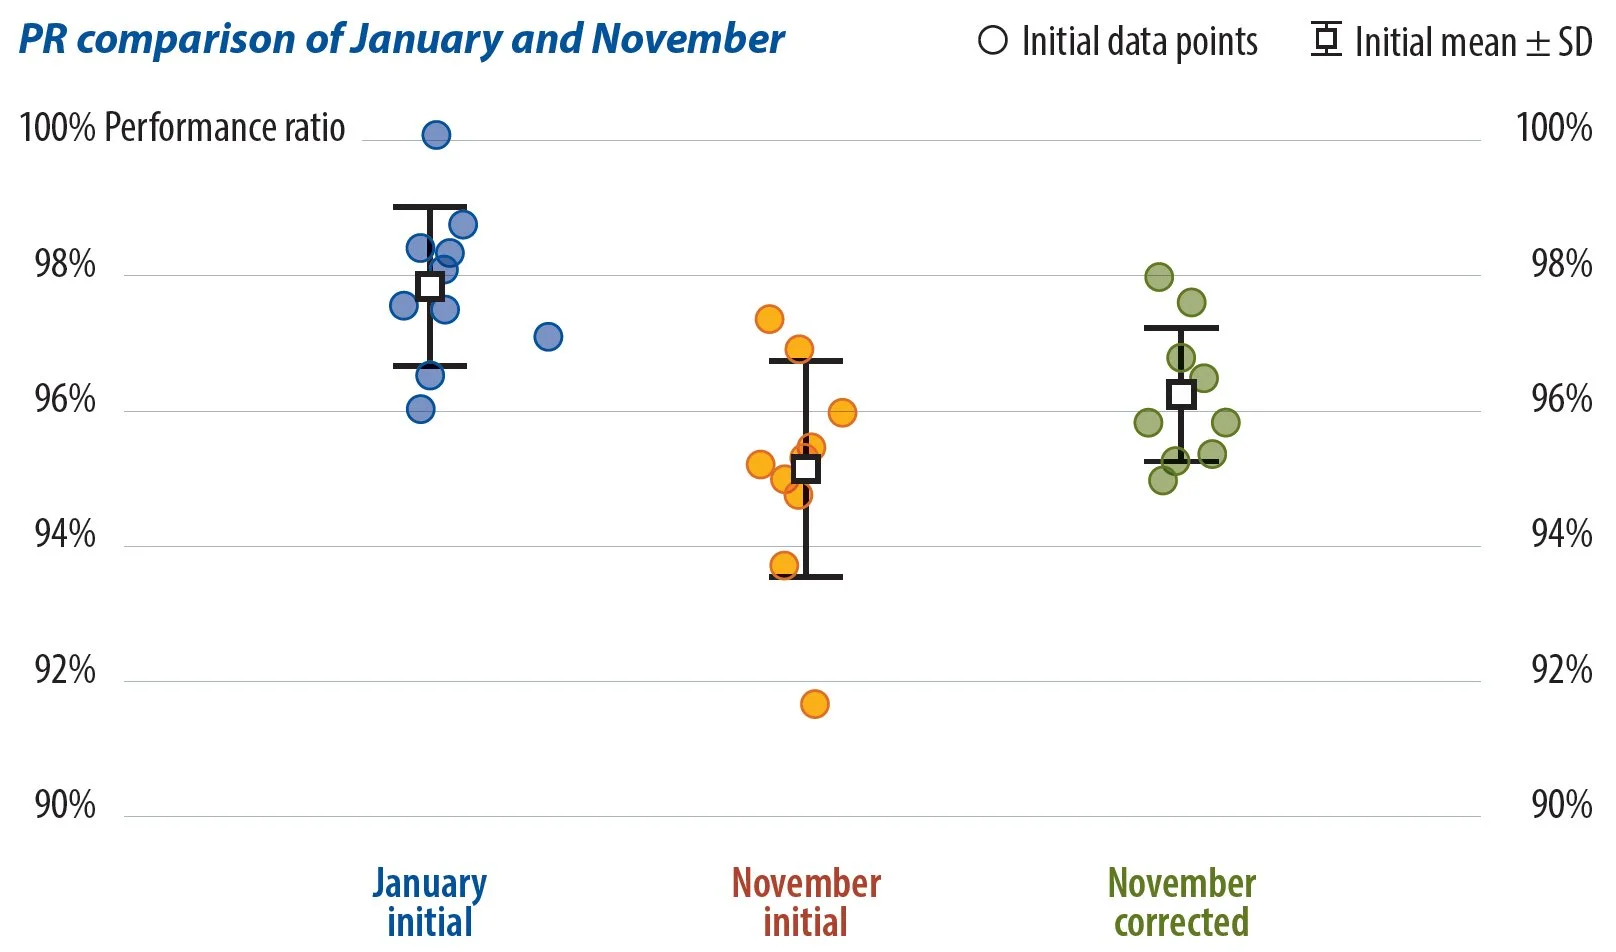
PR comparison of January and November
This suggests that different samples underwent varying degrees of degradation. It also demonstrates that, without considering the effect of power degradation, the performance across modules was relatively stable and differences could be due to temperature and irradiance differences between January and November.
Reviewing the degradation data after the retest, seven out of 10 samples exhibited a degradation rate between 0.5% and 1.0% after one year of operation, with an average degradation of 0.6%. While the Astronergy and Trinasolar modules maintained stable power output with virtually no degradation, three others experienced significant declines. This substantial variation in degradation rates is the primary driver behind the widening distribution of PR values across the samples.
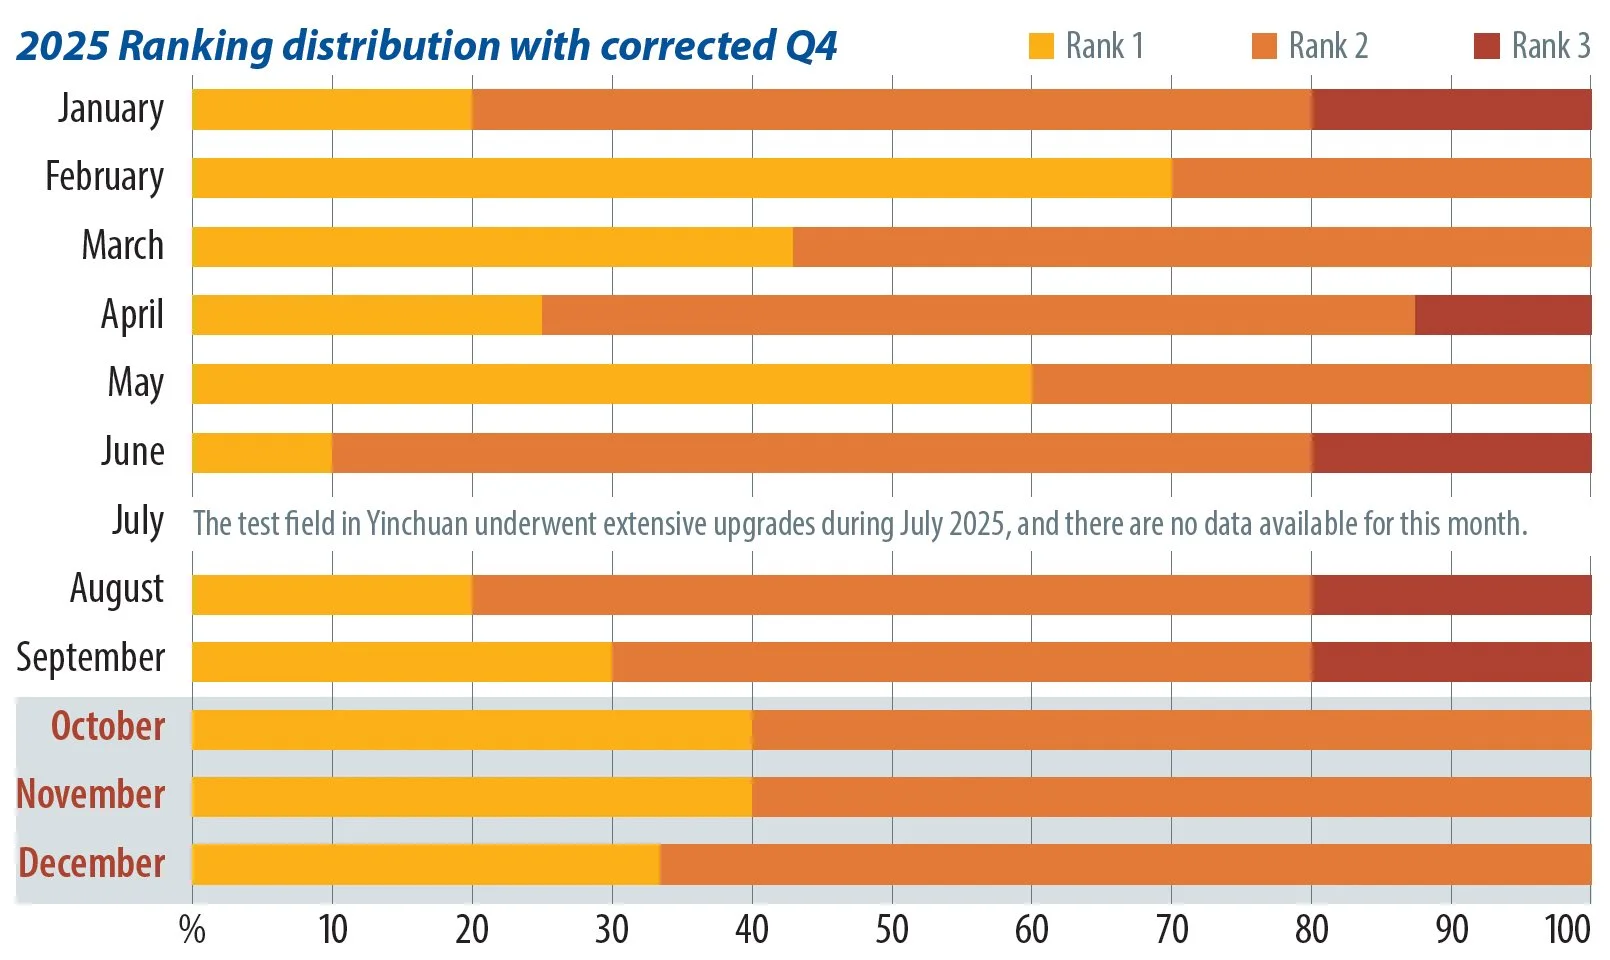
2025 ranking distribution with corrected Q4
Recalculating the Q4 2025 performance rankings with updated power ratings shifted all 10 samples back into Rank 1 or Rank 2, with a notable increase in Rank 1 placements. This suggests that previous underperformance was primarily due to power degradation. It is likely that this degradation began earlier in the year, also contributing to the Rank 3 results observed in the third quarter.
Degradation drivers
We conducted a detailed analysis of the three samples with the highest degradation to understand their unique performance drivers.
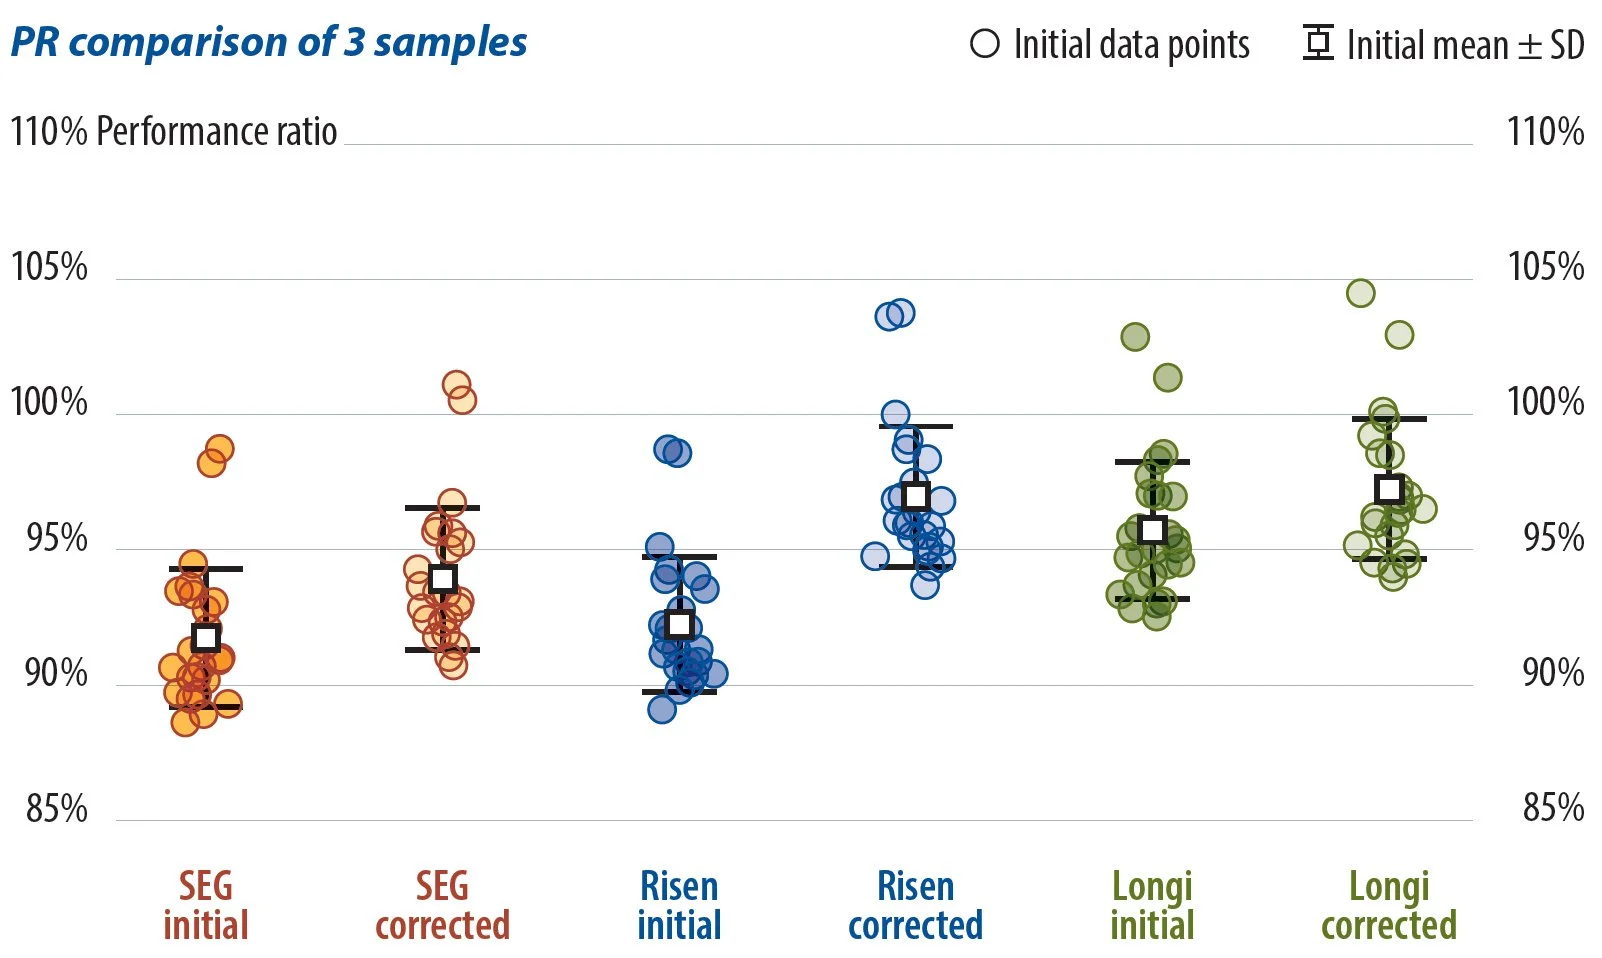
PR comparison of 3 samples
Longi (TOPCon), produced before December 2023: Despite a higher- than-average degradation of 1.54%, the Longi sample consistently maintained a mid-level Rank 2 position despite belonging to an earlier generation of TOPCon technology. Further testing revealed that its superior low-irradiance response and favorable temperature coefficient effectively compensated for the power degradation.
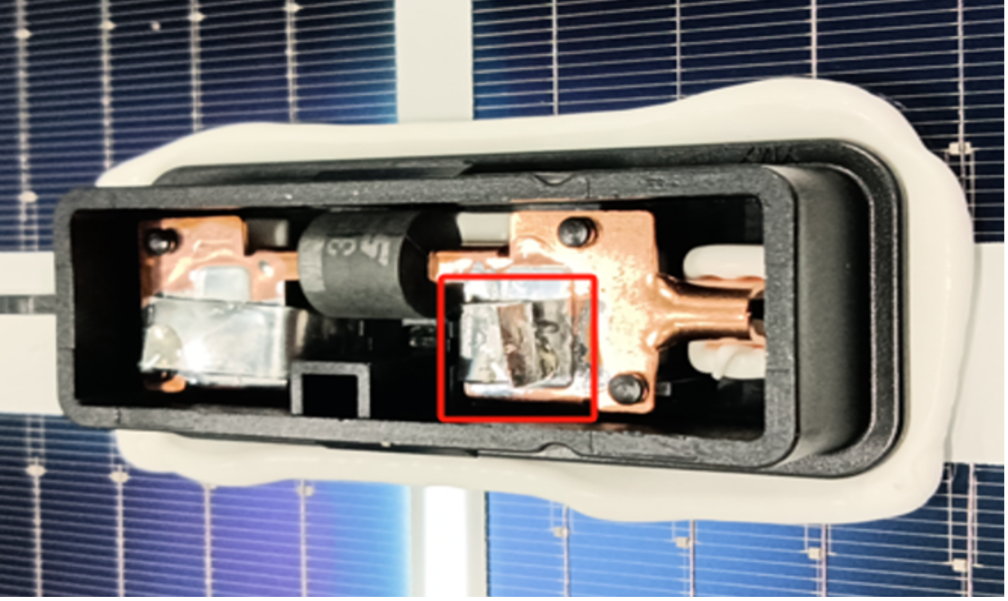
Risen (HJT), produced before November 2024: The Risen HJT module has some of the best energy-yield-related properties of all samples (very good low‑irradiance response and temperature coefficient) but suffered the highest degradation at 4.89%, likely due to ultra-violet induced degradation (UVID). However, once the PR was corrected for this degradation, it became one of the top-performing products.
SEG (TOPCon), produced before October 2023: While degradation compensation improved the SEG sample’s PR by approximately 2%, its adjusted performance remains significantly lower than that of Risen or Longi. We attribute this to the use of early-generation TOPCon cells, which are less advanced in energy conversion than the newer generation.
Our analysis, coupled with industry data, points to UVID as probably the most important factor in module field degradation. When degradation is factored out of the results, TOPCon and HJT modules perform well, with the possible exceptions of early generation products that haven’t been optimized for higher energy generation.
Some, but not all manufacturers, have managed to tackle UVID. However, production consistency remains an issue and buyers must exercise cautious due diligence during the procurement process and production of their orders.